Long before the presidential election was held, the media was awash with pundits calculating the Electoral College votes for each candidate and working out how each of the candidates could get to the magic number of 270 votes that would give them the presidency. Even campaign heads and staffers of the candidates were all over the airwaves talking up the routes to 270 for their candidates, and their campaign’s plans on how to get to that number of Electoral College votes. During this period, nobody spoke about the popular vote as the determining factor in who becomes president.
Neither the political pundits nor the campaigns and their staff spoke about winning the popular vote as a way to the White House. All the calculation was on the number of Electoral College votes needed, and the easiest or best route to acquiring them. What this means is that everybody clearly understood how the presidential election system of the United States works. Everyone knew that the Electoral College votes decide who becomes President of the United States, and not the popular votes.
Considering the above, the current uproar against the Electoral College in the wake of the election of Donald J Trump as president of the United States smacks of politically motivated attacks. It’s amazing how the Democratic party and its agents and minions are suddenly against the Electoral College on which they based their political calculations prior to the presidential election, to the point where they’re accusing the new president of illegitimacy because he didn’t win the popular vote.
This is even more ridiculous when you consider that the Democratic party’s candidate in that election, Hillary Clinton, was so confident in her path to the 270 Electoral College votes that her campaign decided to ignore many parts of the country in order to focus on “the quickest route to collect the 270 Electoral College votes she needs to win the White House.” ~ Thomas Beaumont The Associated Press
“The last two elections have given Democrats an electoral path for victory, and our strategy is to efficiently use our resources to lock down the support we need to reach 270 electoral votes.” Clinton campaign adviser John Anzalone once said during the elections. Today, however, Democrats are so anti Electoral College votes that they believe President Trump should be denied the presidency even though he won 306 Electoral College votes, 36 more vote than he required, and 74 more than Hillary Clinton.
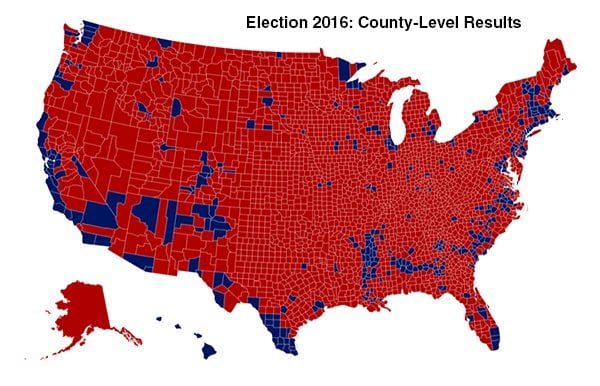
This can be considered a landslide victory under normal circumstances, but Democrats think he should not be president because his opponent won more popular votes than he did. This is despite the fact that Mr Trump won more states, 30, to Mrs Clinton’s 20,
as well as winning more battleground states 8 to her 5.
13 Swing States
| Clinton | Trump | Others | Clinton % | Trump % | Others % | Dem ’12 Margin | Dem ’16 Margin | Margin Shift | Total ’12 Votes | Total ’16 Votes | Raw Votes vs. ’12 | |
| AZ | 1161167 | 1252401 | 159,597 | 45.1% | 48.7% | 6.2% | -9.1% | -3.5% | 5.5% | 2,299,254 | 2,573,165 | 11.9% |
| CO | 1,338,870 | 1,202,484 | 238,866 | 48.2% | 43.3% | 8.6% | 5.4% | 4.9% | -0.5% | 2,569,521 | 2,780,220 | 8.2% |
| FL | 4504975 | 4617886 | 297,178 | 47.8% | 49.0% | 3.2% | 0.9% | -1.2% | -2.1% | 8,474,179 | 9,420,039 | 11.2% |
| IA | 653,669 | 800,983 | 111,379 | 41.7% | 51.1% | 7.1% | 5.8% | -9.4% | -15.2% | 1,582,180 | 1,566,031 | -1.0% |
| ME | 357735 | 335593 | 54,599 | 47.8% | 44.9% | 7.3% | 15.3% | 3.0% | -12.3% | 713,180 | 747,927 | 4.9% |
| MI | 2,268,839 | 2,279,543 | 250,902 | 47.3% | 47.5% | 5.2% | 9.5% | -0.2% | -9.7% | 4,730,961 | 4,799,284 | 1.4% |
| MN | 1,367,716 | 1,322,951 | 254,146 | 46.4% | 44.9% | 8.6% | 7.7% | 1.5% | -6.2% | 2,936,561 | 2,944,813 | 0.3% |
| NV | 539260 | 512058 | 74,067 | 47.9% | 45.5% | 6.6% | 6.7% | 2.4% | -4.3% | 1,014,918 | 1,125,385 | 10.9% |
| NH | 348,526 | 345,790 | 49,842 | 46.8% | 46.5% | 6.7% | 5.6% | 0.4% | -5.2% | 710,972 | 744,158 | 4.7% |
| NC | 2189316 | 2362631 | 189,617 | 46.2% | 49.8% | 4.0% | -2.0% | -3.7% | -1.6% | 4,505,372 | 4,741,564 | 5.2% |
| OH | 2,394,164 | 2,841,005 | 261,318 | 43.6% | 51.7% | 4.8% | 3.0% | -8.1% | -11.1% | 5,580,840 | 5,496,487 | -1.5% |
| PA | 2,926,441 | 2,970,733 | 218,228 | 47.9% | 48.6% | 3.6% | 5.4% | -0.7% | -6.1% | 5,753,546 | 6,115,402 | 6.3% |
| WI | 1,382,536 | 1,405,284 | 188,330 | 46.5% | 47.2% | 6.3% | 6.9% | -0.8% | -7.7% | 3,068,434 | 2,976,150 | -3.0% |
Non-Swing States by Popular Votes
| Clinton | Trump | Others | Clinton % | Trump % | Others % | Dem ’12 Margin | Dem ’16 Margin | Margin Shift | Total ’12 Votes | Total ’16 Votes | Raw Votes vs. ’12 | |
| AL | 729,547 | 1,318,255 | 75,570 | 34.40% | 62.10% | 3.60% | -22.20% | -27.70% | -5.50% | 2,074,338 | 2,123,372 | 2.40% |
| AK | 116,454 | 163,387 | 38,767 | 36.60% | 51.30% | 12.20% | -14.00% | -14.70% | -0.70% | 300,495 | 318,608 | 6.00% |
| AR | 380494 | 684872 | 65,269 | 33.70% | 60.60% | 5.80% | -23.70% | -26.90% | -3.20% | 1,069,468 | 1,130,635 | 5.70% |
| CA | 8,753,788 | 4,483,810 | 943,997 | 61.70% | 31.60% | 6.70% | 23.10% | 30.10% | 7.00% | 13,038,547 | 14,181,595 | 8.80% |
| CT | 897,572 | 673,215 | 74,133 | 54.60% | 40.90% | 4.50% | 17.30% | 13.60% | -3.70% | 1,558,114 | 1,644,920 | 5.60% |
| DE | 235,603 | 185,127 | 20,860 | 53.40% | 41.90% | 4.70% | 18.60% | 11.40% | -7.20% | 413,890 | 441,590 | 6.70% |
| DC | 282,830 | 12,723 | 15,715 | 90.90% | 4.10% | 5.00% | 83.60% | 86.80% | 3.10% | 293,764 | 311,268 | 6.00% |
| GA | 1,877,963 | 2,089,104 | 125,306 | 45.90% | 51.00% | 3.10% | -7.80% | -5.20% | 2.70% | 3,900,050 | 4,092,373 | 4.90% |
| HI | 266,891 | 128,847 | 33,199 | 62.20% | 30.00% | 7.70% | 42.70% | 32.20% | -10.50% | 434,697 | 428,937 | -1.30% |
| ID | 189,765 | 409,055 | 91,435 | 27.50% | 59.30% | 13.20% | -31.90% | -31.80% | 0.10% | 652,274 | 690,255 | 5.80% |
| IL | 3,090,729 | 2,146,015 | 299,680 | 55.80% | 38.80% | 5.40% | 16.90% | 17.10% | 0.20% | 5,242,014 | 5,536,424 | 5.60% |
| IN | 1033126 | 1557286 | 144,546 | 37.80% | 56.90% | 5.30% | -10.20% | -19.20% | -9.00% | 2,624,534 | 2,734,958 | 4.20% |
| KS | 427,005 | 671,018 | 86,379 | 36.10% | 56.70% | 7.30% | -21.70% | -20.60% | 1.10% | 1,159,971 | 1,184,402 | 2.10% |
| KY | 628,854 | 1,202,971 | 92,324 | 32.70% | 62.50% | 4.80% | -22.70% | -29.80% | -7.10% | 1,797,212 | 1,924,149 | 7.10% |
| LA | 780,154 | 1,178,638 | 70,240 | 38.40% | 58.10% | 3.50% | -17.20% | -19.60% | -2.40% | 1,994,065 | 2,029,032 | 1.80% |
| MD | 1677928 | 943,169 | 160,349 | 60.30% | 33.90% | 5.80% | 26.10% | 26.40% | 0.30% | 2,707,327 | 2,781,446 | 2.70% |
| MA | 1,995,196 | 1,090,893 | 238,957 | 60.00% | 32.80% | 7.20% | 23.10% | 27.20% | 4.10% | 3,167,767 | 3,325,046 | 5.00% |
| MS | 485,131 | 700,714 | 23,512 | 40.10% | 57.90% | 1.90% | -11.50% | -17.80% | -6.30% | 1,285,584 | 1,209,357 | -5.90% |
| MO | 1,071,068 | 1,594,511 | 143,026 | 38.10% | 56.80% | 5.10% | -9.40% | -18.60% | -9.30% | 2,757,323 | 2,808,605 | 1.90% |
| MT | 177,709 | 279,240 | 40,198 | 35.70% | 56.20% | 8.10% | -13.70% | -20.40% | -6.80% | 484,048 | 497,147 | 2.70% |
| NE | 284,494 | 495,961 | 63,772 | 33.70% | 58.70% | 7.60% | -21.80% | -25.00% | -3.30% | 794,379 | 844,227 | 6.30% |
| NJ | 2,148,278 | 1,601,933 | 123,835 | 55.50% | 41.40% | 3.20% | 17.80% | 14.10% | -3.70% | 3,640,292 | 3,874,046 | 6.40% |
| NM | 385234 | 319666 | 93,418 | 48.30% | 40.00% | 11.70% | 10.10% | 8.20% | -1.90% | 783,758 | 798,318 | 1.90% |
| NY | 4,547,218 | 2,814,346 | 348,562 | 59.00% | 36.50% | 4.50% | 28.20% | 22.50% | -5.70% | 7,072,083 | 7,710,126 | 9.00% |
| ND | 93,758 | 216,794 | 33,808 | 27.20% | 63.00% | 9.80% | -19.60% | -35.70% | -16.10% | 322,932 | 344,360 | 6.60% |
| OK | 420,375 | 949,136 | 83,481 | 28.90% | 65.30% | 5.70% | -33.50% | -36.40% | -2.80% | 1,334,872 | 1,452,992 | 8.80% |
| OR | 1002106 | 782403 | 216,827 | 50.10% | 39.10% | 10.80% | 12.10% | 11.00% | -1.10% | 1,789,270 | 2,001,336 | 11.90% |
| RI | 252,525 | 180,543 | 31,076 | 54.40% | 38.90% | 6.70% | 27.50% | 15.50% | -11.90% | 446,049 | 464,144 | 4.10% |
| SC | 855,373 | 1,155,389 | 92,265 | 40.70% | 54.90% | 4.40% | -10.50% | -14.30% | -3.80% | 1,964,118 | 2,103,027 | 7.10% |
| SD | 117,458 | 227,721 | 24,914 | 31.70% | 61.50% | 6.70% | -18.00% | -29.80% | -11.80% | 363,815 | 370,093 | 1.70% |
| TN | 870,695 | 1,522,925 | 114,407 | 34.70% | 60.70% | 4.60% | -20.40% | -26.00% | -5.60% | 2,458,577 | 2,508,027 | 2.00% |
| TX | 3,877,868 | 4,685,047 | 406,311 | 43.20% | 52.20% | 4.50% | -15.80% | -9.00% | 6.80% | 7,993,851 | 8,969,226 | 12.20% |
| UT | 310,676 | 515,231 | 305,523 | 27.50% | 45.50% | 27.00% | -48.00% | -18.10% | 30.00% | 1,017,440 | 1,131,430 | 11.20% |
| VT | 178,573 | 95,369 | 41,125 | 56.70% | 30.30% | 13.10% | 35.60% | 26.40% | -9.20% | 299,290 | 315,067 | 5.30% |
| VA | 1,981,473 | 1,769,443 | 231,836 | 49.80% | 44.40% | 5.80% | 3.90% | 5.30% | 1.50% | 3,854,489 | 3,982,752 | 3.30% |
| WA | 1,742,718 | 1,221,747 | 401,179 | 51.80% | 36.30% | 11.90% | 14.90% | 15.50% | 0.60% | 3,125,516 | 3,365,644 | 7.70% |
| WV | 188,794 | 489,371 | 34,886 | 26.50% | 68.60% | 4.90% | -26.80% | -42.20% | -15.40% | 670,438 | 713,051 | 6.40% |
| WY | 55,973 | 174,419 | 25,457 | 21.90% | 68.20% | 10.00% | -40.80% | -46.30% | -5.50% | 249,061 | 255,849 | 2.70% |